Lord of the Machines - Data Science Hackathon

This post provides my solution for Lord of the Machines: Data Science Hackathon hosted on Analytics Vidhya. This solution ranked 8th on the private leaderboard. The code can be found in this GitHub repository.
Precicting User Click Probability of Links inside a Mailer for E-mail Campaigns
Email Marketing is still the most successful marketing channel and the essential element of any digital marketing strategy. Marketers spend a lot of time in writing that perfect email, labouring over each word, catchy layouts on multiple devices to get them best in-industry open rates & click rates. How can I build my campaign to increase the click-through rates of email? - a question that is often heard when marketers are creating their email marketing plans. It’s time to unlock marketing potential and build some exceptional data-science products for email marketing.
So, in this hackathon, the challenge was to predict the click probability of links inside a mailer for email campaigns from January 2018 to March 2018.
Data Overview
The train dataset used comprised of user-email interaction data of AV email campaigns from July 2017 to December 2017. The task was to predict the click probability of links inside a mailer for email campaigns from January 2018 to March 2018, which formed the test dataset.
Dataset Description
campaign_data.csv - Contains the features related to 52 email Campaigns
| Variable | Definition |
|---|---|
| campaign_id | Email campaign ID |
| communication_type | Email agenda |
| total_links | Total links inside the email |
| no_of_internal_links | Total internal links inside the email (redirecting to analyticsvidhya.com) |
| no_of_images | Number of images inside the email |
| no_of_sections | Number of sections inside the email |
| email_body | Email Text |
| subject | Email Subject |
| email_url | Email URL |
train.csv - Contains the click and open information for each user corresponding to given campaign id (Jul 2017 - Dec 2017)
| Variable | Definition |
|---|---|
| id | Unique ID for email session |
| user_id | User ID |
| campaign_id | Email Campaign ID |
| send_date | Time stamp for email sent |
| is_open | Did not open - 0, Opened -1 |
| is_click | Did not click - 0, clicked - 1 |
test.csv - Contains the user and campaigns for which is_click needs to be predicted (Jan 2018 - Mar 2018)
| Variable | Definition |
|---|---|
| id | Unique ID for email session |
| campaign_id | Email Campaign ID |
| user_id | User ID |
| send_date | Time stamp for email sent |
Feature Extraction
Prominent Features Extracted -
- Date
- Time (in minutes)
- Day of Week
- Communication Type
- Total Links
- No of Internal Links, No of Images
- Subject - Count of Sentences, Letters, Punctuations and Stopwords
- Subject - Unique Word Percentage
- Subject - Punctuation Percentage
- Email - Count of Word, Punctuation and Capital Letters
- Count Click
- Count User
- Click Confidence
- Count of People Opening the Mail
- Open Confidence
- Email Similarity, Subject Similarity
- Subscription Period
- Communication Type Click Percentage
- Count User Frequency
- Sentiment of Mail
Correlation between Extracted Features and Output

Data Analysis
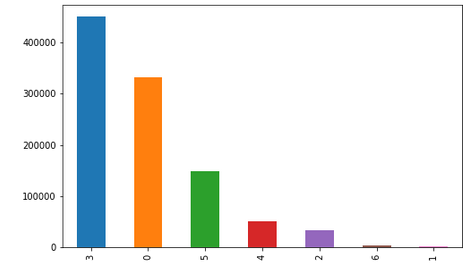
No of Emails per Communication Type

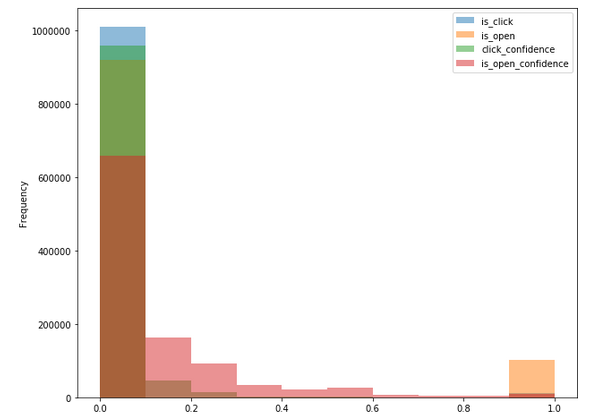
Distribution of Click Confidence, Open Confidence, Is Open and Is Click

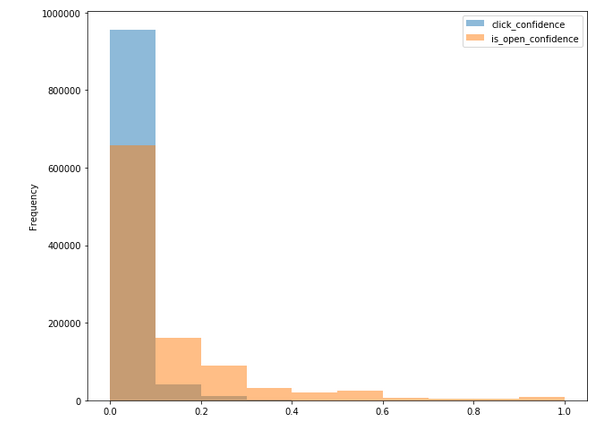
Distribution of Click Confidence and Open Confidence for Is Click=0

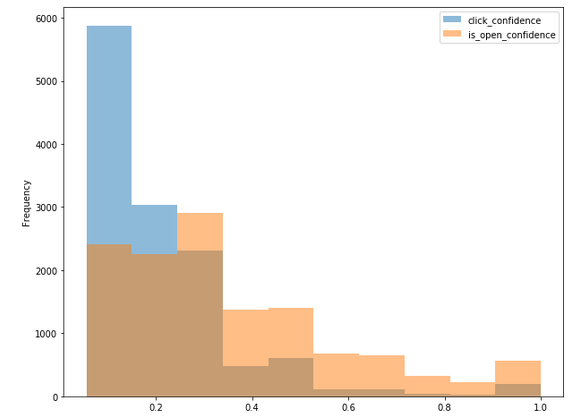
Distribution of Click Confidence and Open Confidence and Is Click=1

Further data analysis - Link
Undersampling using Repeated Edited Nearest Neighbour Algorithm
The train dataset was highly imbalanced and contained 1010409 samples with is_click=0 while only 12782 samples with is_click=1.

After undersampling the data using RENN, the number of samples with is_click=0 was reduced to 958301. Other algorithms such as ENN, AllKNN and SMOTE were also explored. But I found RENN to the best of all though it required significant amount of time to undersample the dataset.
Our Solution
The overall solution consists of a weighted average ensemble of two boosting algorithms.
- XGBoost
- LightGBM
Results
| Sr No. | Public LB AUC | Private LB AUC |
|---|---|---|
| LightGBM | 0.68173 | - |
| XGBoost | 0.66823 | - |
| Ensemble | 0.68799 | 0.68630 |
Key Points
- LightGBM outperformed XGBoost by a significant margin. Moreover, it required much less time to train than XGBoost.
- Extracting prominent features provided a major boost to the score. Most of these features were based on modelling user characteristics and extracting time series properties.
- Undersampling the data also provided a significant increase in the score.
- Boosting algorithms mostly ruled the competition.
Thank You!
Important Links
GitHub Repository
What is LightGBM?
XGBoost
Lord of the Machines: Data Science Hackathon